
SPY Is Expensive, But There Are Hiding Places
[ad_1]

Eoneren
Thesis
The goal of this article is twofold, both quite straightforward. First, it will analyze how expensive the SPDR S&P 500 Trust ETF (NYSEARCA:SPY) has really become after its recent rallies. And second, it will analyze some of the alternative places to invest in case we successfully accomplish our first goal and convince you how expensive SPY currently is.
In the remainder of this article, you will see the main reasons and data that show SPY to be very expensive, actually among the most expensive levels since the dot.com bubble. We will discuss the lofty Shiller CAPE ratio and it could signal an overvalued stock market. This, coupled with the narrow yield spread between S&P 500 earnings and safe-haven treasury yields, suggests a diminishing return on investment for the SPY. With equities offering historically low premiums compared to bonds, an equity market correction could be imminent.
Then we will analyze some of the alternative investment ideas and our allocation strategies. We believe trimming some of the SPY exposure now and putting the proceeds into these alternatives can help us to lock in profits and avoid significant losses if the market adjusts to more balanced valuations.
SPY: Basics and highlights
First, some basic info about the fund itself. The fund is very well known and needs little introduction.
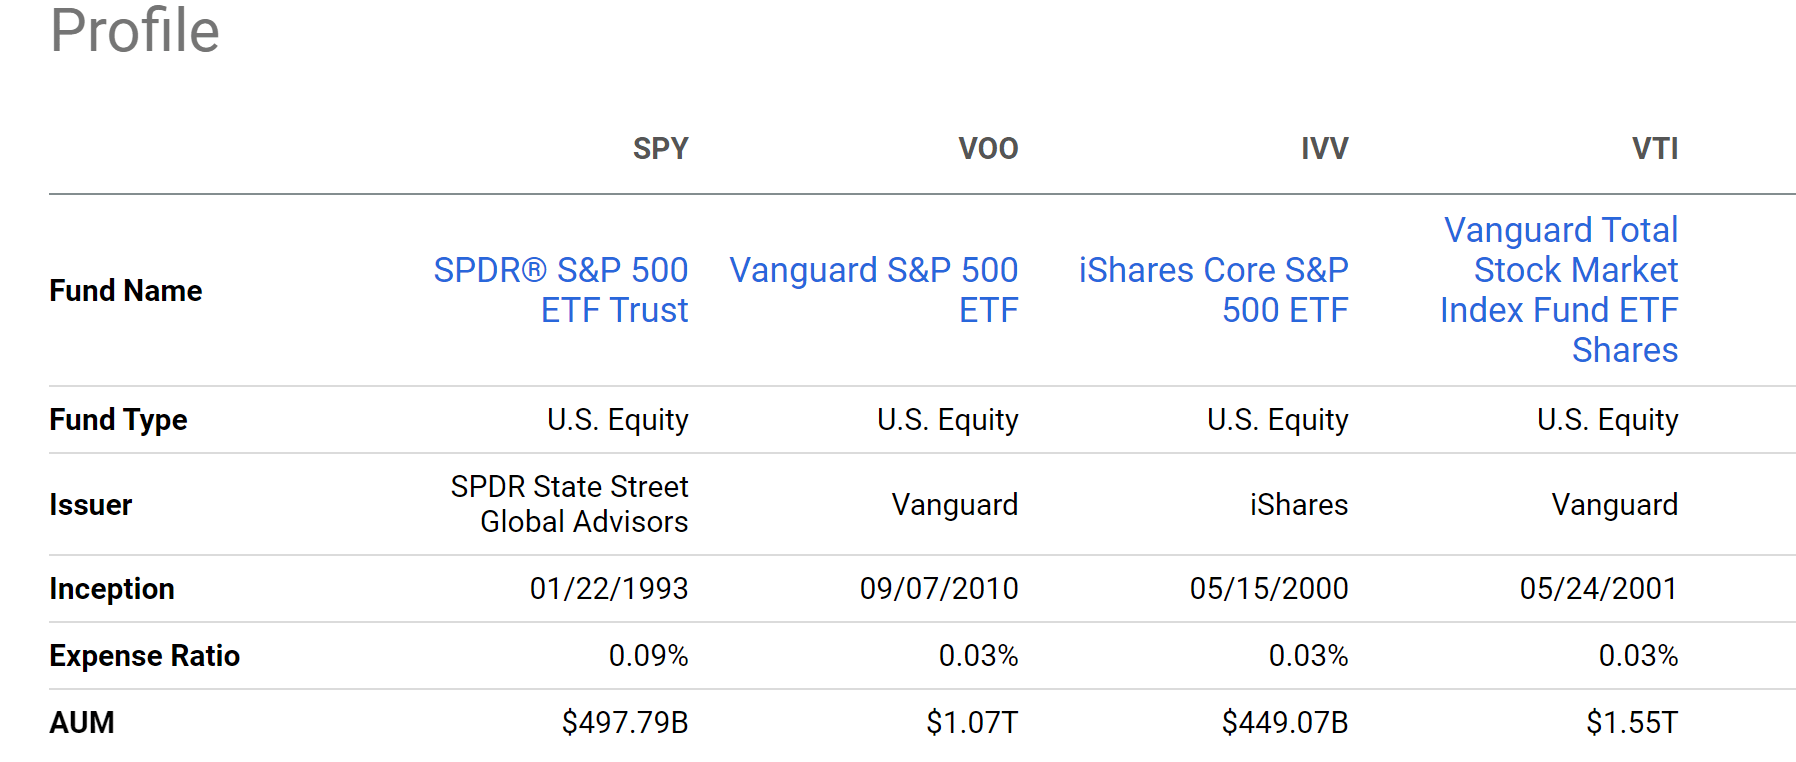
So here I will mainly anchor the introduction with a comparison against SPY’s close peers like VOO, IVV, and VTI to highlight some often-overlooked differences. The SPY ETF tracks the S&P 500 index. Like many other overall-market funds, it holds shares of the 500 largest companies in the market across all eleven GICS sectors. This makes it very similar to the other ETFs listed such as VOO and IVV. Although VTI is different in that it tracks more stocks, not only the largest 500, in the market. All these funds are passively managed. SPY features the highest expense ratio (0.09%), while all the other three ETFs have expense ratios of 0.03%. In terms of fund size, SPY is the third largest fund out of the four, with a total AUM of $497 billion. VTI is the largest with a market capitalization of $1.55 trillion.
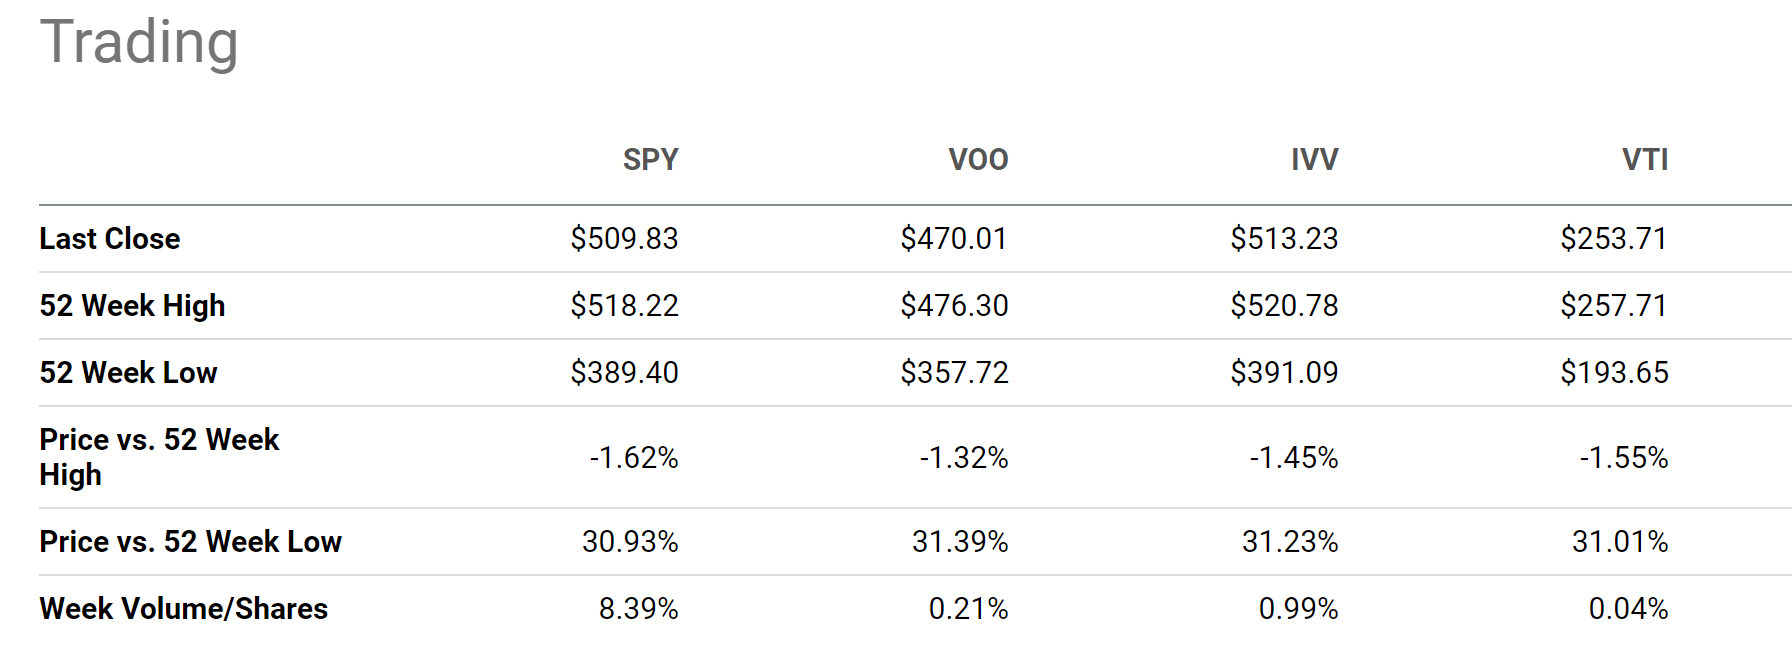
Overall, these ETFs are all very similar and a good choice for investors looking for broad exposure to the US stock market. Choosing between them may come down to factors such as expense ratio and personal preference for the fund issuer. SPY’s higher expense ratio could be justified by its tradability and visibility. SPY is the oldest fund out of the four, was launched in 1993, and probably is the best-known ETF fund in its space. Also, despite its smaller AUM, it features a much higher trading volume than its large peers. As shown in the second chart below, on a weekly basis, about 8.4% of its total share change hands. While only 0.04% of the shares are traded for VTI, the biggest of these four in terms of AUM.
Seeking Alpha
Seeking Alpha
How expensive is SPY?
The Shiller P/E ratio for the S&P 500 index, on which the SPY is based, currently hovers around 34.2x as shown in the chart below. This is the third highest level in at least 50 years as seen. The current level is only lower than the peak values during the dot com bubble and the epic easing shortly after the COVID breakout.
![spy]](https://static.seekingalpha.com/uploads/2024/3/18/54495410-17107689390737948_origin.png)
Shiller CAPE
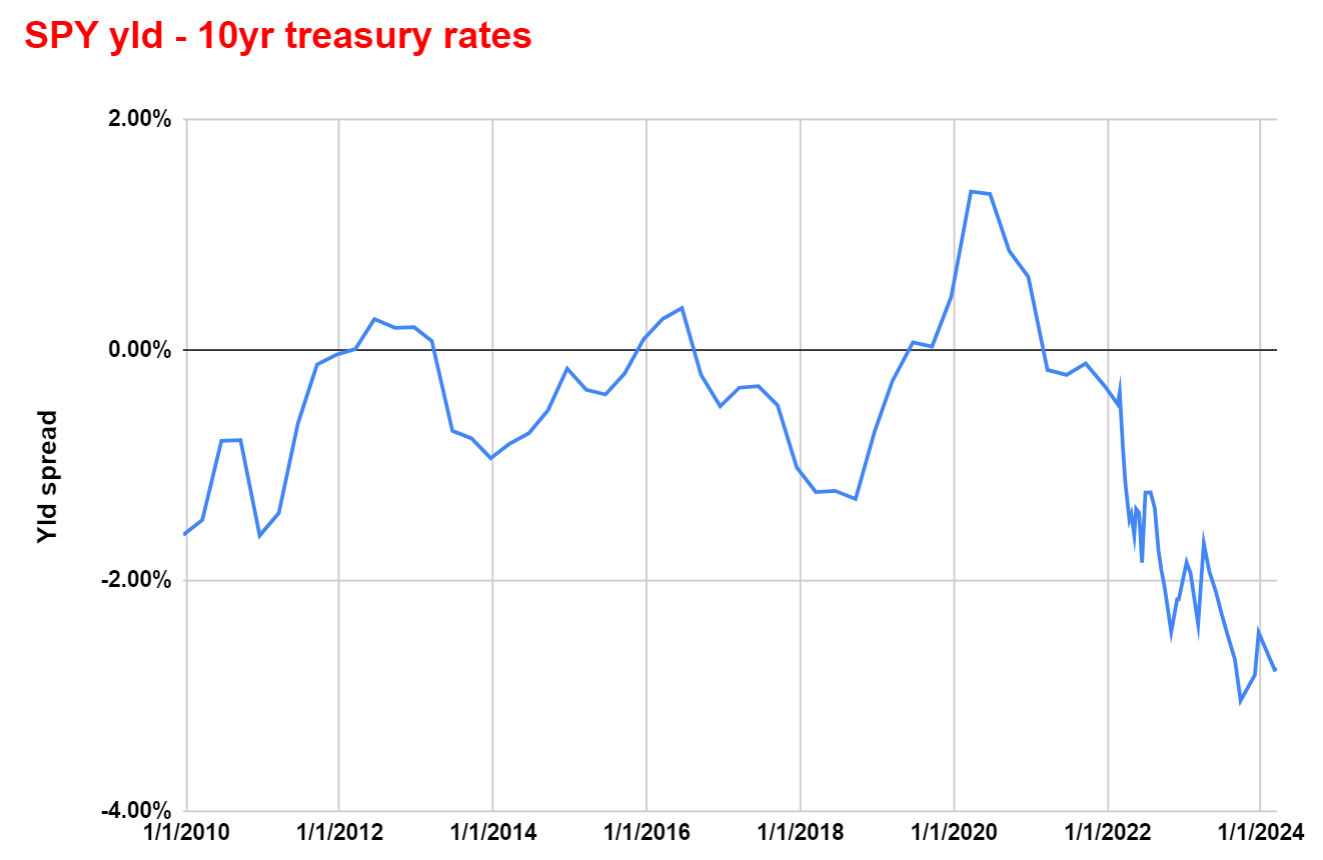
Next, remember that all valuations should be contextualized by risk-free rates. The next chart shows the yield spread between SPY and 10-year Treasury rates since 2010, used here to approximate risk-free rates. As seen, the spread between the SPY and 10-year Treasury yields appears to be negative for most of the period shown. This means that the dividend yield SPY has been lower than the interest rate on 10-year Treasuries, which makes total sense because SPY is more focused on growth rather than providing a fixed income. The concerning sign is the current yield spread is near negative 3% (1.3% SPY yield minus about 4.3% treasury rates), close to the lowest levels since at least 2010.
Author
What are our alternative ideas?
With the above analysis of how expensive SPY current is, the next logical question is what other alternative ideas then?
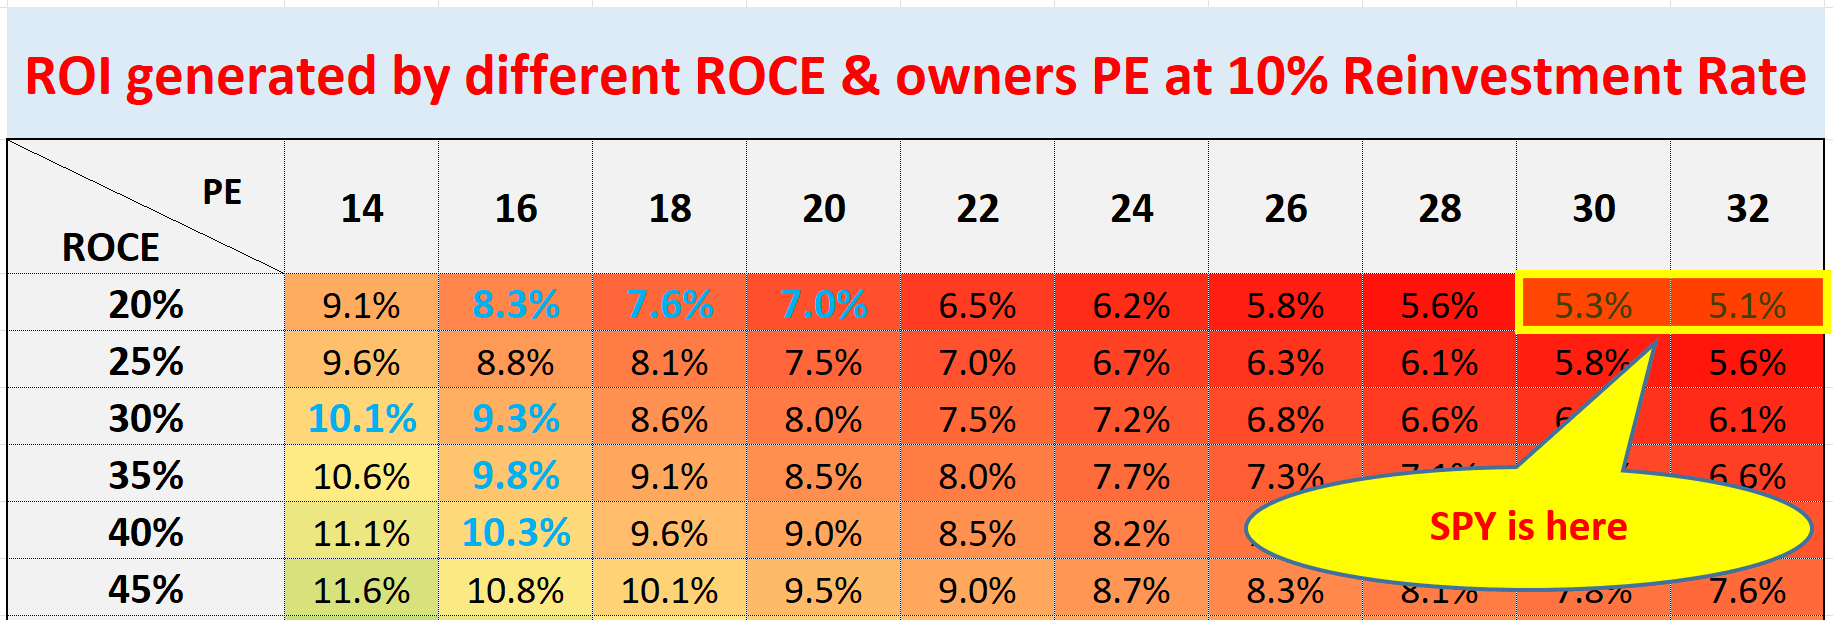
First, given the above data of the yield spread, we think bonds are an attractive alternative with Treasuries yielding close to 4.5% and investment-grade corporate bonds yielding 5%-plus. The next chart shows my projection for SPY’s long-term return, which is about 5.1%. The projection is a combination of two drivers: At best ~3% from earning yield (with Shiller CAPE around 34x) and about 2% from growth. The growth rate is estimated by the average return on capital employed (which is about 20% for SPY) and an assumption of a 10% reinvestment rate. With Treasury bonds yielding ~4.5%, we see little potential for SPY to outperform bonds under current conditions despite the extra risks (say from a recession or correction).
Author
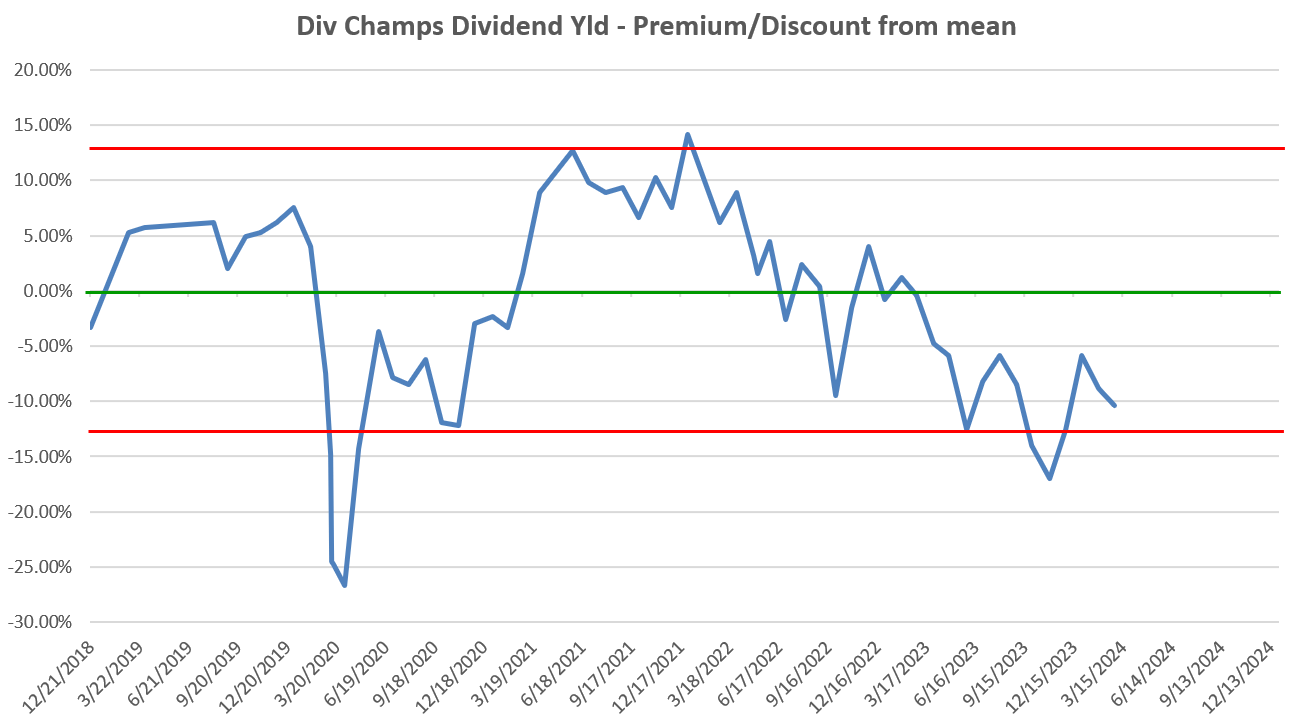
Second, the bad news is that the overall market represented by SPY is expensive. However, the good news is that the overvaluation is not uniformly distributed. There are niche areas where the valuations are still reasonable. A notable example involves the dividend champions, stocks that have consecutively increased their dividends for at least 25 years. As you can see from the following chart, the average yield of this group is currently quite attractive. This chart shows the dividend yield of this group of stocks (a total of 148 of them as of March 2024) compared to its historical mean (the green line). The average yield of this group of stocks is about 2.88%. And the long-term average yield of them is about 2.58% (again, shown by the green line below). Therefore, the current yield is about 10.4% above the historical mean, implying the most attractive valuation in multiple years as seen. So, investors could either consider this group as a replacement for SPY (and SCHD would be a convenient vehicle) or buy some of the individual stocks among the dividend champions.
Author
Risks and final words
Before closing, I want to emphasize the limitations in our analysis presented above. More details of our approach and the limitations are elaborated in this early article. Our approach extensively uses the dividend yield from SPY (and also the dividend champions) as a valuation metric. However,
Dividend yields do not always reflect business fundamentals accurately due to distortion by things irrelevant to business fundamentals, such as tax law and political climate. As a result, we do NOT actually use the simple difference as described above. We have to correct (and you should too) the distortions first. But the simple difference provides a good approximation already and illustrates the essence of our dynamic allocation idea.
With this, the last two charts below contain our actual holdings in our accounts, showing how we put our money where our mouth is. Overall, we follow a dynamic allocation model to adjust our equity-bond ratio (currently at 64%) based on their relative valuation as analyzed above. Our portfolio currently lags SPY by a bit (around 2%). Although note that A) how our method reduces volatility despite the use of leverage funds like TQQQ thanks to the dynamic allocation, and B) our past experience has taught us that our method would generate a definitive alpha after one full credit-debt cycle. Our feeling is that this round of rate hike cycle could be ending soon.
Finally, these charts also show a few more alternative ideas. As said, we like Treasury bonds and dividend champions and hold quite a few of them. The first additional alternative idea involves the Financial Select Sector SPDR Fund ETF (XLF). Our thoughts are detailed in an earlier article here. The fund has appreciated sizably since then. But XLF now still features one of the top three most attractive valuations according to our analysis (again based on dividend yield and yield spread against risk-free interests) among all market sectors. Our second additional alternative idea involves precious metals such as gold and silver, both of which we hold a sizable position. Interested readers could find more details in this recent article.
To conclude, the purpose of this article is twofold. First, we wanted to assess how expensive SPY is. Second, based on that assessment, we wanted to analyze some of the alternative investment ideas besides SPY. By the Shiller P/E ratio, SPY now hovers around the third highest level in at least 50 years, only lower than the peak during the dot.com bubble and the epic easing shortly after the COVID breakout in 2021. By yield spread relative to treasury bonds, it is even more expensively valued than during the epic easing. Our alternative ideas include dynamic allocation with bonds, dividend stocks, selected sectors that are less overvalued, and also precious metals.

Author
author
[ad_2]
Read More: SPY Is Expensive, But There Are Hiding Places