
How The S&P 500 Could Actually Be Closer To 4,200 Than 5,000
[ad_1]
mixmotive
The celebration ensued as the S&P 500 Index crossed 5,000 recently. That’s roughly the equivalent of the SPDR S&P 500 Trust ETF (NYSEARCA:SPY) advancing past $500, as it did on a closing basis for the first time on February 9 of this year.
Investors have been treated to a phenomenal gain in SPY since the autumn bottom in 2022. Here’s what SPY has done since September 30 of that year: a 44% gain in 17 months. That’s living!
Yet, as many investors realize, that gain has been akin to a few players on a team carrying the whole squad to a championship. It happens, but there’s a Wall Street saying, “bad breadth,” that has nothing to do with simple chronic halitosis, i.e., bad breath. That’s investment lingo for when the “headline” indicators of stock health don’t tell the full story.
SPY closed the year 2016 at $223.53. Tuesday, it closed at $506.14. I don’t know which is more of a shock to the system for a long-time market watcher like me: that SPY is over $500 a share now, or that just 8 years ago it was at $223.53! As a conservative investor who used to cater to preservation-focused clients as a fiduciary advisor and investment manager, and now spends his days doing research, writing and mentoring, I can truly look back and admit, “Wow, I left a lot of meat on that bone!”
Because as investors should realize, before it is too late, that seeing SPY vault from $223 to $506 during that period of time is a classic case seen throughout stock market history. Specifically, that risk is inherent in the stock market, even if it is not realized every time.
This sets up a period in which investors need to be very cognizant of where we’ve been, how we got here, and generally speaking, that capitalization weighted indexes and equal weighted versions of the same index may not look at all alike. The investment conclusion to me: don’t get addicted to the recent success of cap weighting when looking at investing in the broad stock market.
How we got here
As seen below, that 17-month romp for SPY was well above that of the same 500 stocks if they had been equally weighted instead of capitalization weighted. Furthermore, if we look at a few other subsets of the S&P 500, that 44% return for SPY looks even more impressive, albeit very top-heavy.
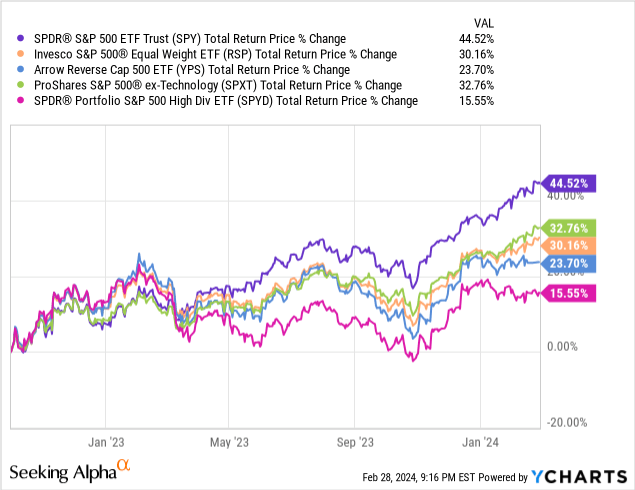
Simply removing technology stocks shaved 14% or about 1/3 off the rally. And if the biggest stocks were weighted the lowest and vice versa, as portrayed by the blue line, the SPY return is cut in half. Sure, this is all hindsight, but it speaks to a market that mimics the way the middle class in the US has been gradually hollowed out over the decades, such that a small portion of the population owns the vast majority of the wealth. Such is the state of the US economy in 2024.
Finally, in the above chart, that pink line shows how the 80 highest-yielding S&P 500 stocks have performed. Or, shall I say, underperformed. The good news is that this laggard segment of SPY still earned nearly 1% per month over the past 17 months. But when we consider that came on the back of a steep decline across the board during most of 2022 in just about any slice of the SPY/S&P 500 one analyzes, the longer-term picture is, to use a not so technical term, “meh.”
That got me thinking, and here’s what I explored
I’ve seen narrow markets before. And I have observed that they are usually late-cycle conditions. Since the post-pandemic stock market is historically unique in many ways, I don’t for a minute assume that history will repeat and that the stock market will follow up this “concentrated” up move with a collapse. However, as one who prioritizes risk management over all else, I am certainly watching extremely carefully for signs that the SPY dominance over different mixes of the same stocks or important segments of the S&P 500 does indeed represent a red flag.
So I set out to see where the SPY would be now, versus the $500+ level it actually sits at, if the Standard & Poor’s company had decided years ago that their index of the top 500 US stocks should be equally weighted instead of market cap weighted. After all, that decision long ago has changed the nature of investing as we know it. Because so much money has flooded into S&P 500 indexing strategies, “passive” investing is now in a very different state than it was in the past. That is, all those index assets are crowded into a relatively small number of stocks. 10 stocks make up about 1/3 of SPY right now. That’s historically very rare.
Seeking Alpha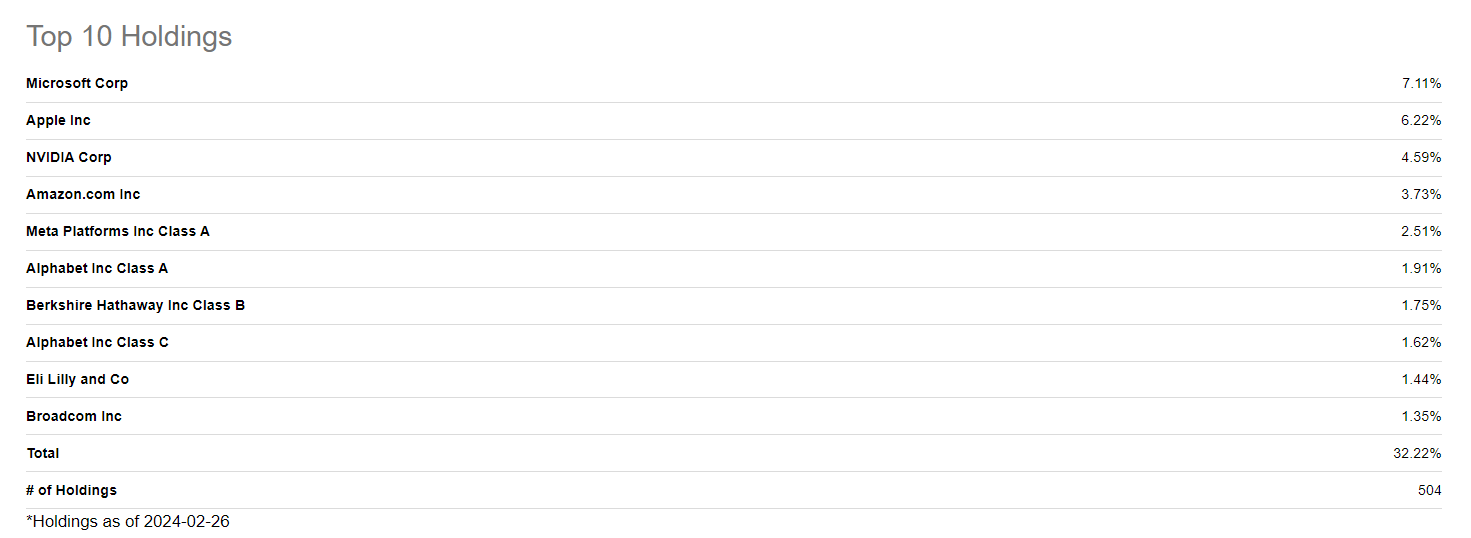
It wasn’t always this way. Here’s a comparison of SPY to the Invesco S&P 500 Equal Weight ETF (RSP) since their common inception date in 2006 (SPY started back in 1993).
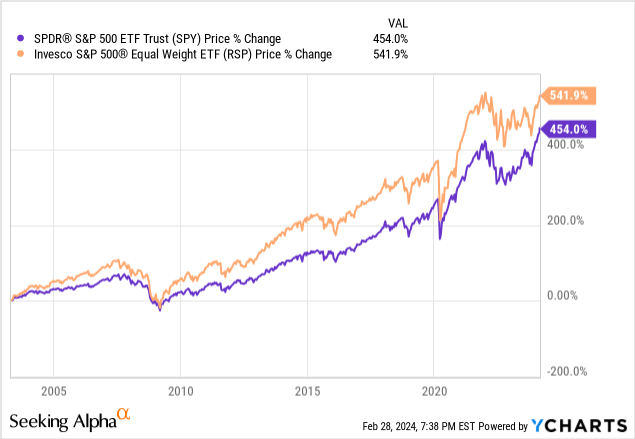
The orange line has spent nearly the entire period above the purple line. That is, equal weight S&P 500 investing has outperformed the cap weighted version continuously from 2006 forward.
Fake news or signs of a potential bubble?
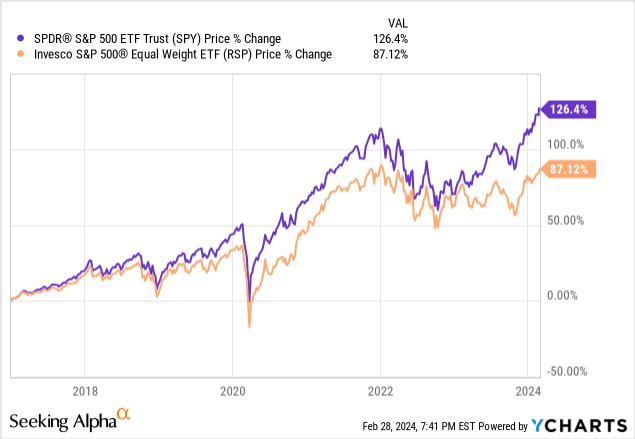
Ah, but many of today’s less-tenured investors would probably call that “fake news.” After all, look at the past 7 years, since the start of 2017. There’s a reason I started there. It is because 2016 was, in my view, the Fed’s big chance to simply let the economy do its thing. But instead of allowing nature to run its course, where the Fed could have finally managed the economy like it wasn’t still in the crisis of 2008 – it didn’t. Instead, every market tantrum was greeted with a band-aid by the Fed, in action or simply in language. And that extended the “easy money” era, which was only compounded when the pandemic hit in 2020.
That’s a long way of saying that this happened. SPY outperformed RSP by a mile, and investors increasingly hopped on board… by owning the cap weighted version of the S&P 500, which created a self-fulfilling prophecy. The big got bigger and the rest were rendered impotent.
What drove that wedge between the purple and orange lines above? Here’s a snapshot look at the attribution within SPY over the past 5 years, to give us an idea. Do we see anything of note? I do! I see how the Magnificent 7 got their name. There they are, taking up 7 of the 8 top spots, with the other one naturally going to the makers of Ozempic.
In the bottom part of the picture immediately below, we also see that some well-known businesses spent the past 5 years, to use a technical term, “sucking wind.” This might be a clue as to where long-term values may be found from here, but I’ll reserve stock-by-stock commentary for upcoming articles. The point here is that the market has been carried across the threshold by a relatively small number of stocks, for too long to simply blow it off as an investor. It can certainly continue on, but the risk that it doesn’t has become too glaring to ignore.
Ycharts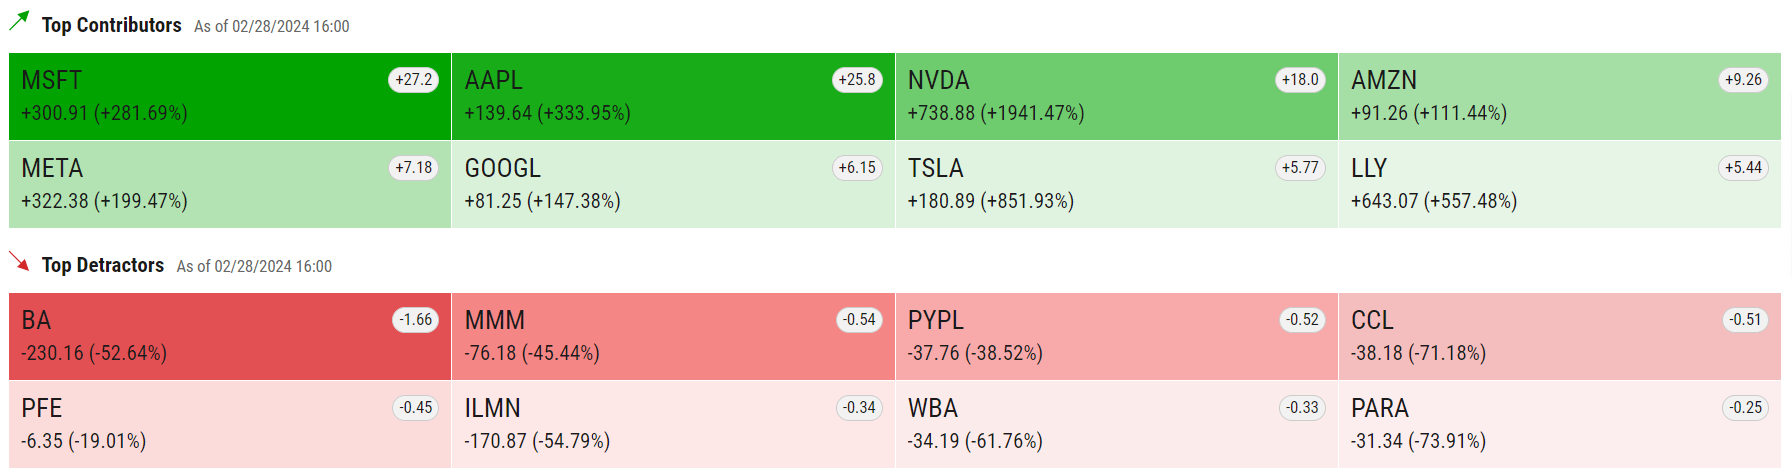
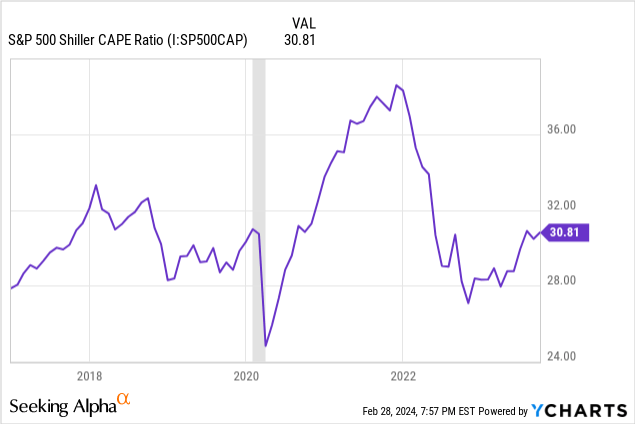
High valuations have persisted through this period, as measured by the Shiller CAPE Ratio, a version of a Price-Earnings Ratio that factors in inflation and looks at earnings over a longer time frame than just the past one year.
Where would the S&P 500 be if equal weighting had been the law of the land?
Again, SPY closed the year 2016 at $223.53. Tuesday, it closed at $506.14. So if we take that starting level and instead of applying the 126% gain in SPY since the start of 2017, and instead assume that RSP was “the market” (since it is the same stocks, but weighted equally, as many investors do anyway in their own portfolios). The answer: $418.27. Or just under 4,200 on the S&P 500.
Now, I am realistic. I am not looking to change the past, but simply to point out that if we strip out the excess return that is displayed by comparing SPY to another very viable method of mixing and allocating the very same stocks, we get a market that is more reasonably valued. But that’s not what we have.
Conclusions
I’m not about predicting the future, but as I look for value and yield at a reasonable price (YARP, my trademarked dividend stock indicator), I’m going to think more like those 500 stocks are to be judged equally, rather than being tempted to chase what just did well. I’ve seen too many stock market “rodeos” to be confident that the past 7 years’ trend can continue for years to come. If it does, I plan to try hard to earn my “fair share” of the gains using the methods and security selections I write about on Seeking Alpha, as well as the hedging techniques and heavy dose of short-term Treasury securities that I’ve detailed over the past year or so here.
[ad_2]
Read More: How The S&P 500 Could Actually Be Closer To 4,200 Than 5,000