
SDY: S&P 500 High Dividend Stocks Continue To Lag, A Higher P/E Today (NYSEARCA:SDY)
[ad_1]
Abu Hanifah
It has been six months since the correction of Q3 and early Q4 2023 ended. Over that time, the S&P 500 has returned about 22%, dividends included, led by large-cap growth stocks and even outperformance from some value niches. The high-dividend factor has underperformed, however.
I reiterate a hold rating on the SPDR S&P Dividend ETF (NYSEARCA:SDY). Along with producing negative alpha, the fund has turned more expensive while its technical situation is less than impressive.
Six-Month ETF Performance Heat Map: SDY Lags SPY
Finviz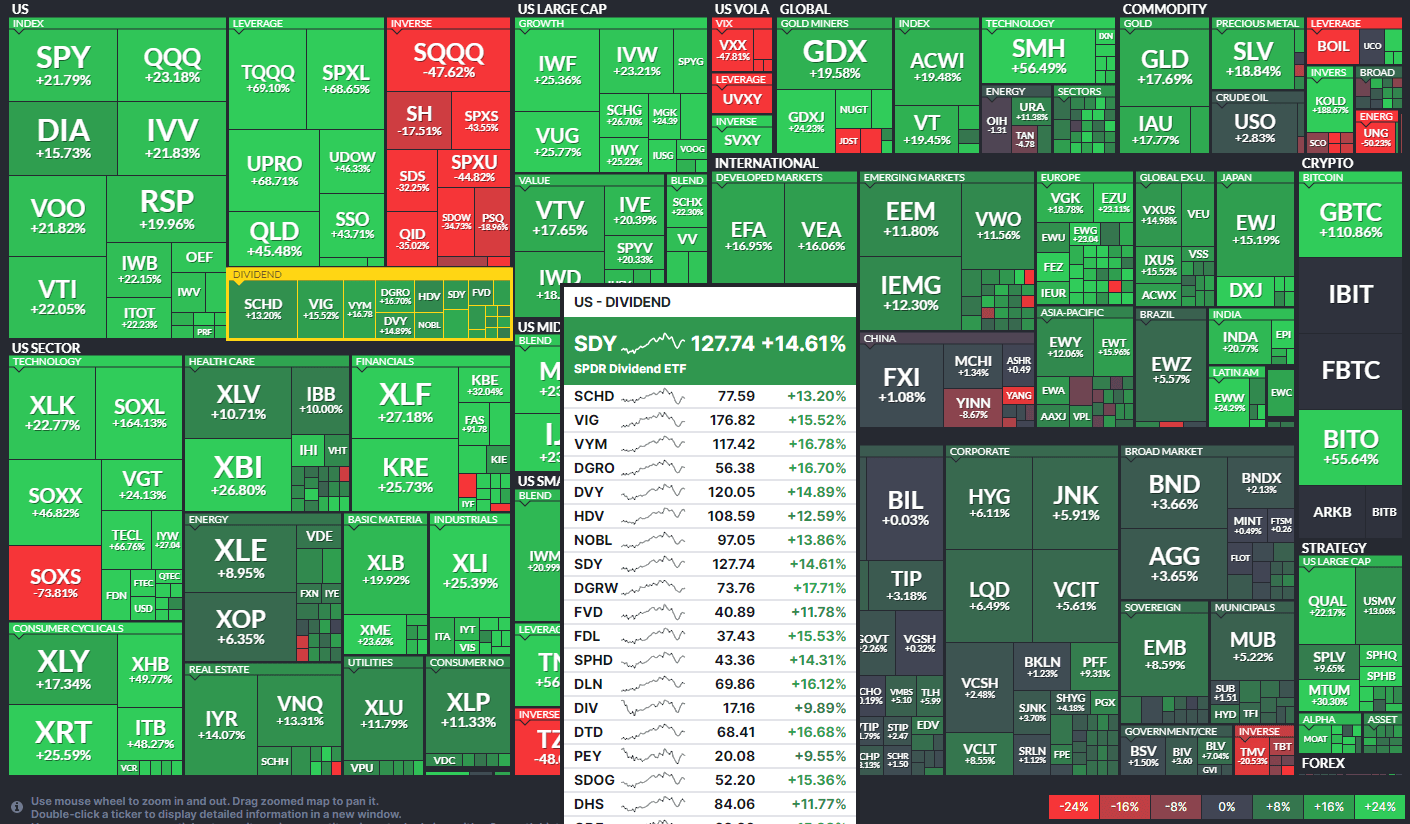
According to the issuer, SDY offers investors exposure to the highest-yielding stocks in the S&P Composite 1500 Index via tracking the S&P High Yield Dividend Aristocrats Index. The fund follows a passively managed approach whereby it owns shares of firms that have a history of increasing dividends every year for at least 20 consecutive years. Stocks within the Index are weighted by indicated yield (annualized gross dividend payment per share divided by price per share) and weight-adjusted each quarter.
SDY is a large ETF with more than $20 billion in assets under management as of April 25, 2024, though that is down $2 billion from when I last looked at the fund in 2023, and it pays a high 2.6% trailing 12-month dividend yield – that’s about twice that of the S&P 500. SDY has a moderate expense ratio of 0.35% considering the simple strategy and share-price momentum has improved in the last several months, but I will detail why I am cautious about both its relative and absolute price action looking ahead to the rest of the year.
Risk metrics are not particularly great given the fund’s concentration and standard deviation history while liquidity with SDY is very healthy. The ETF’s average daily volume is more than 300,000 shares and its 30-day median bid/ask spread is just two basis points.
Looking closer at the portfolio, the 4-star, Silver-rated fund by Morningstar has diversification across the style box, but there is a pronounced orientation to large-cap value. In total, just 5% of SDY is considered growth. And considering that the ETF’s price-to-earnings ratio is now above 18, about 1.5 turns higher compared to a year ago, I assert that the valuation case is not as attractive today.
SDY: Portfolio & Factor Profiles
Morningstar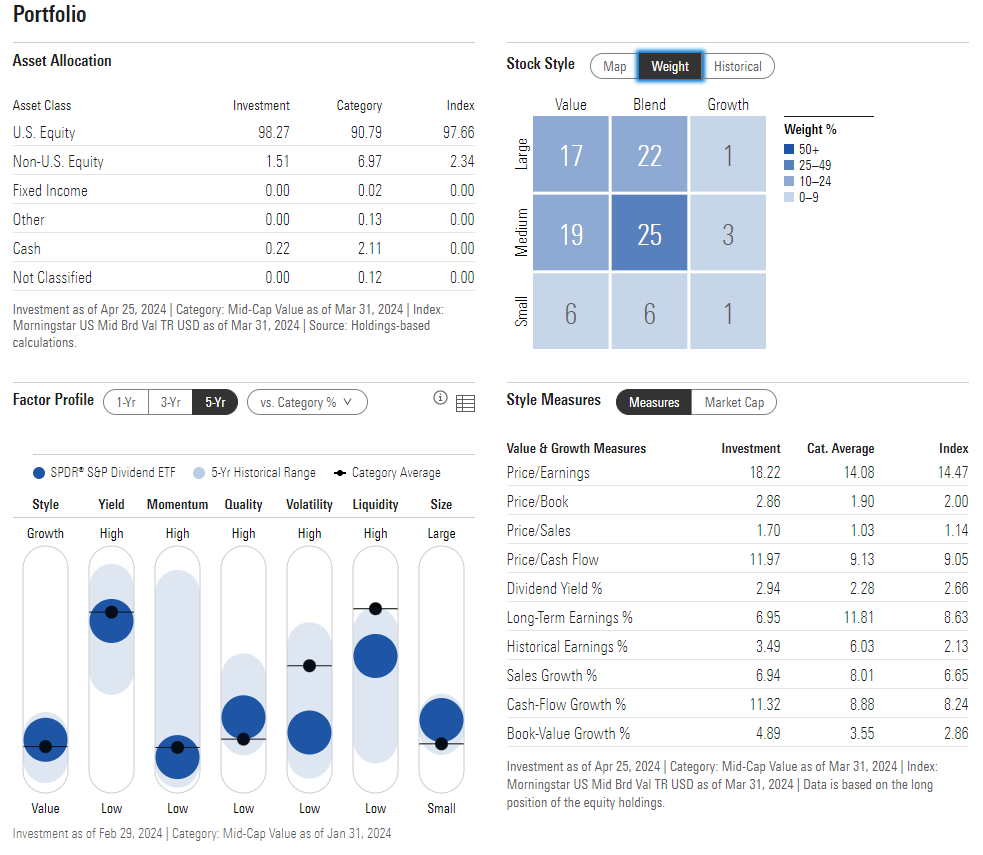
In terms of SDY’s sector breakdown, there is a healthy mix of cyclicals and defensives. The risk-on Industrials space is the largest weight at more than 20%. But then Consumer Staples and Utilities – two areas that often outperform when the stock market sags – are significant overweights. What you will not find much of is growth exposure – the Information Technology sector is just 6.5% of SDY – that’s more than a 20-percentage point underweight versus the S&P 500.
SDY: Cyclical & Defensive Sector Holdings
Seeking Alpha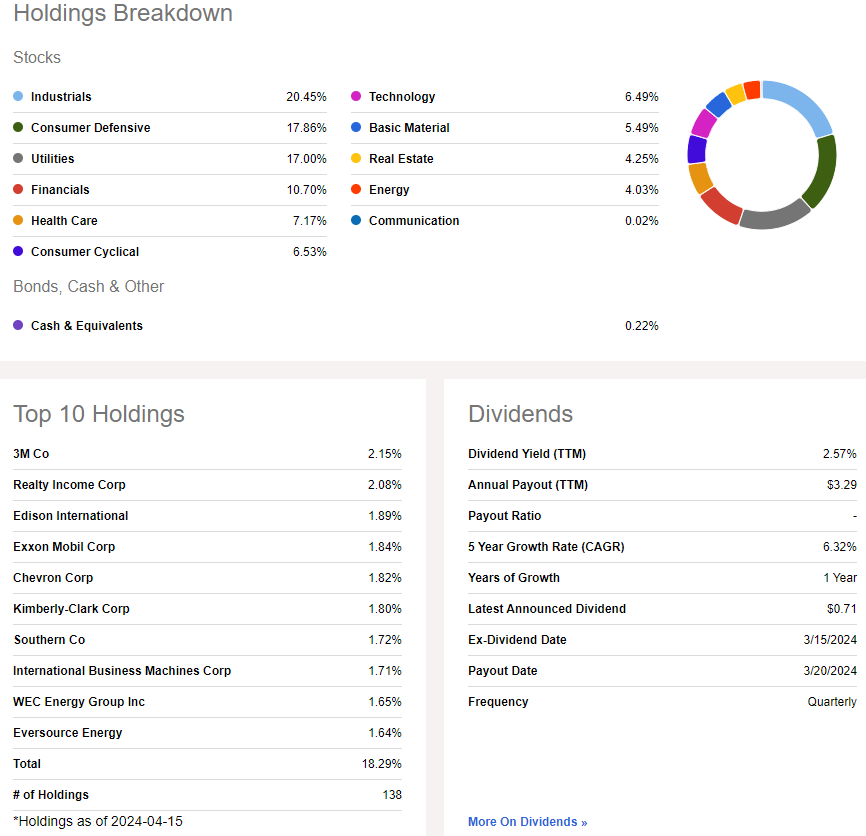
Seasonally, SDY tends to rally now through July, and that is about what happened in 2023. Following a 4.4% gain in March, there is some momentum sprouting up with SDY right now.
SDY: Bullish Seasonal Trends Through July
Seeking Alpha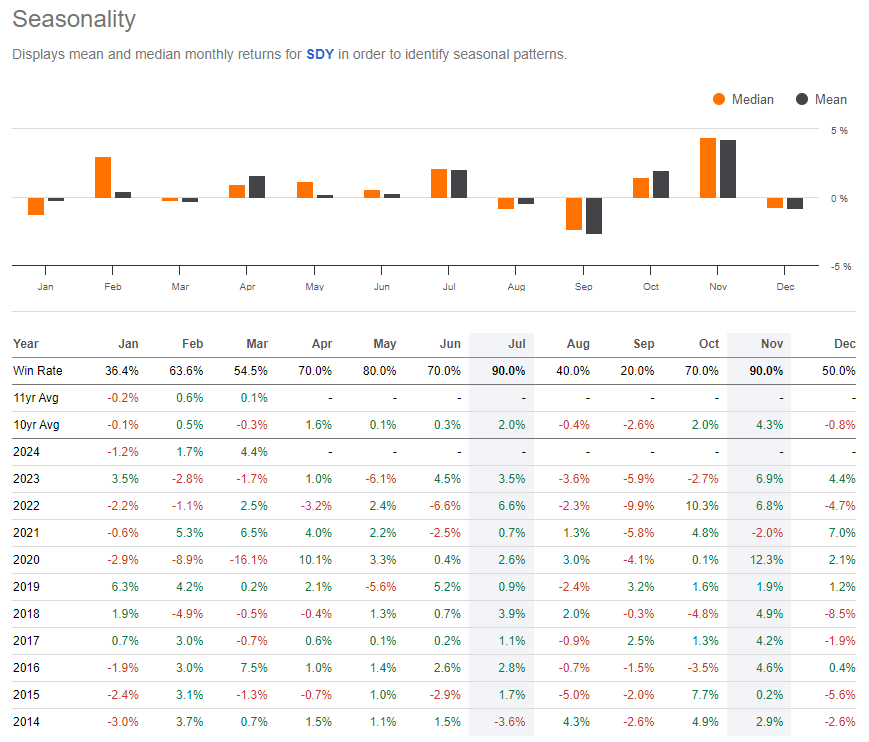
The Technical Take
With more than 15 percentage points of underperformance since I last analyzed SDY, shares are below their high from late in Q1. Notice in the chart below that the fund has obvious resistance in the $130 to $135 range. This is a zone I highlighted in Q2 last year, and the sellers continue to come about when SDY rallies toward it.
Also take a look at the RSI momentum oscillator at the top of the graph – it printed a bearish divergence as price rallied toward the end of the first quarter. The result was a quick retreat toward the rising long-term 200-day moving average. While I like the fact that the 200dma is upwardly sloped, I do not see it as indicative of a strong uptrend right now. Moreover, with a high amount of volume by price down to about $120, the presumption is that SDY will merely churn within this 10% range capped by $133 or so.
SDY: Persistent Resistance Above $130
Stockcharts.com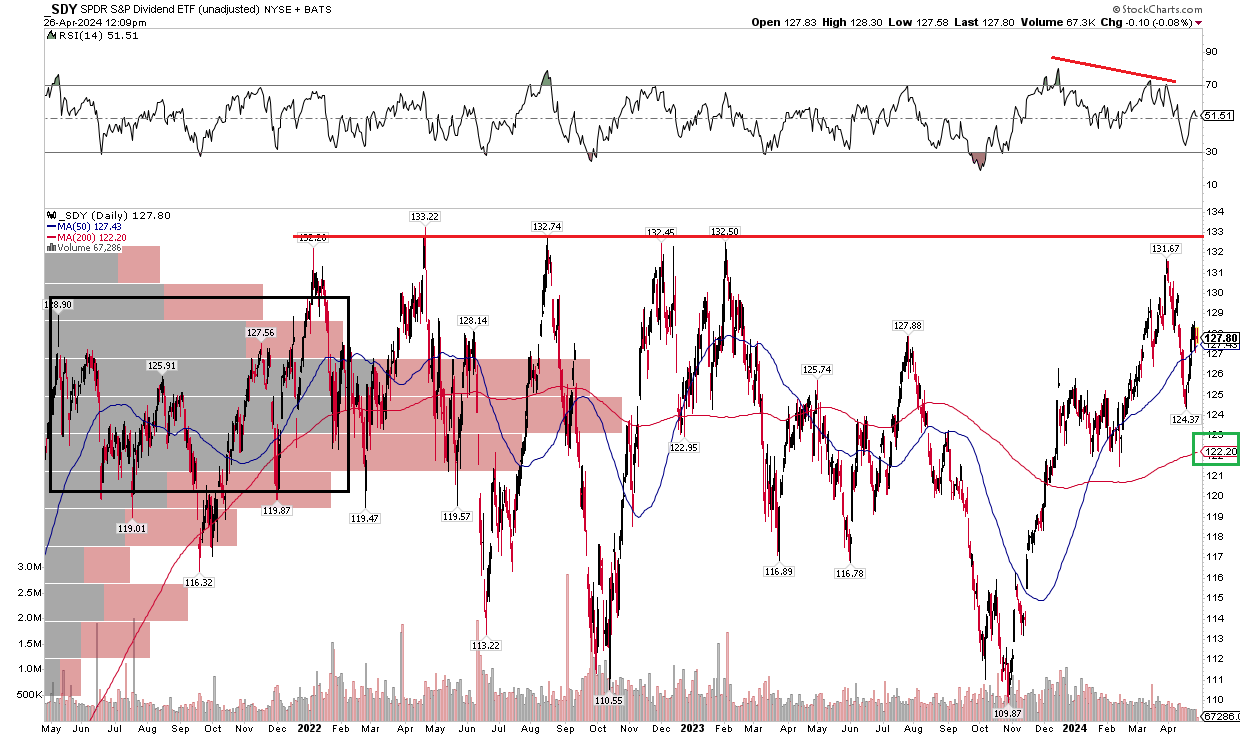
The Bottom Line
I reiterate a hold rating on SDY. I see the value-oriented dividend ETF as not all that cheap considering its sector breakout while price action continues to be neutral on an absolute basis and sharply underperforming the SPX on a relative basis.
[ad_2]
Read More: SDY: S&P 500 High Dividend Stocks Continue To Lag, A Higher P/E Today (NYSEARCA:SDY)